

EXPERIMENT 3: ENZYME
Objectives:
- · To study the reactions of enzyme in different environment.
- · To investigate the properties of the environment that may influence the rate of an enzyme to react.
- · To determine the effect of such reaction to amylase.
Enzymes
are types of protein act as catalyst. Catalysts will speed up the chemical
reactions. Biochemical reactions that take place will react too slowly without
enzymes to keep up with the metabolic needs and the life functions of
organisms. Enzymes have a three-dimensional structure that is very complex.
This three-dimensional structure consists of one or more polypeptide chains.
These polypeptide chains form an active site, an area into which the substrate
will fit. There are four factors that will have an effect on the structure of
an enzyme’s active site, the activity of the enzyme, and the rate of the
reaction in which the enzyme is involved. The four factors that can affect the
activity of an enzyme include temperature, pH, enzyme concentration, and
substrate concentration.
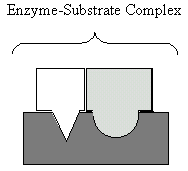
When the enzyme’s active site binds with the substrate like a key
fitting a lock, an enzyme-substrate complex will form. The shape of the
enzyme must match with the shape of the substrate. Enzymes are very specific.
This is because they will only function correctly if the shape of the substrate
matches the active site. After the reaction take place, the products are
released and the enzyme returns to its normal shape. The enzyme remains
unchanged and does not form chemical bonds with the substrate. As a result, the
enzyme molecule can be reused. Only a small amount of enzyme is needed because
they can be used repeatedly.


Procedure

 The effect of temperature
The experiment were prepared as the table
below
Test tube
|
8 ml starch of x mg/ml
|
Water
(ml)
|
Amylase
(ml)
|
Each sample were incubated at 15, 28, 36.6 and 40 ºC
for 10 minutes
|
Iodine
(ml)
|
All test tube were placed in an ice bath for 10
minutes. The absorbance were measured at 590nm
|
1
|
0
|
8
|
1
|
1
|
||
2
|
0.01
|
0
|
1
|
1
|
||
3
|
0.025
|
0
|
1
|
1
|
||
4
|
0.05
|
0
|
1
|
1
|
||
5
|
0.10
|
0
|
1
|
1
|
||
6
|
0.30
|
0
|
1
|
1
|
||
7
|
0.50
|
0
|
1
|
1
|
||
8
|
0.70
|
0
|
1
|
1
|
||
9
|
1.00
|
0
|
1
|
1
|
The Lineweaver-Burke line for the results were plot and compared.
The values of Vmax ang Km were
calculated.
The effect of pH
The experiment were prepared as the table
below
Test tube
|
Starch 0.5 mg/ml
(ml)
|
2ml buffer of pH x
|
Amylase
(ml)
|
Each sample were incubated 36.6 for 10 minutes
|
Iodine
(ml)
|
All test tube were placed in an ice bath for 10
minutes. The absorbance were measured at 590nm
|
1
|
5
|
4
|
1
|
1
|
||
2
|
5
|
5
|
1
|
1
|
||
3
|
5
|
6
|
1
|
1
|
||
4
|
5
|
7
|
1
|
1
|
||
5
|
5
|
8
|
1
|
1
|
||
6
|
5
|
9
|
1
|
1
|
||
7
|
5
|
10
|
1
|
1
|
||
Blank
|
5
|
3 ml of H2O
|
1
|
|||
The values of V for all pH were calculated.
The velocity for each of the pH test were
compared.
Result
A. standard reference
Tubes
|
Starch concentration (M)
|
Amylase (ml)
|
Absorbance (590 nm)
|
1
|
0.000
|
1
|
0.018
|
2
|
0.010
|
1
|
0.060
|
3
|
0.025
|
1
|
0.148
|
4
|
0.055
|
1
|
0.279
|
5
|
0.100
|
1
|
0.472
|
6
|
0.300
|
1
|
1.245
|
7
|
0.500
|
1
|
1.912
|
8
|
0.700
|
1
|
2.471
|
9
|
1.000
|
1
|
3.324
|
i) Graph of Standard Reference

B. The effect of substrate concentration
Tubes
|
Starch concentration (M)
|
Amylase (ml)
|
Absorbance (590 nm)
|
Absorbance
(mg/ml)
/ Sf
|
1
|
0.000
|
1
|
0.064
|
0.015
|
2
|
0.010
|
1
|
0.061
|
0.013
|
3
|
0.025
|
1
|
0.055
|
0.010
|
4
|
0.050
|
1
|
0.058
|
0.011
|
5
|
0.100
|
1
|
0.063
|
0.014
|
6
|
0.300
|
1
|
0.061
|
0.013
|
7
|
0.500
|
1
|
0.062
|
0.014
|
8
|
0.700
|
1
|
0.064
|
0.015
|
9
|
1.000
|
1
|
0.065
|
0.016
|
ii) Graph for the effect of substrate concentration

Tubes
|
Starch
concentration /S◦
|
Amylase
(ml)
|
Absorbance
(590
nm) / 40˚C
|
Absorbance
(mg/ml)
/ Sf
|
1
|
0.000
|
1
|
0.082
|
0.020
|
2
|
0.010
|
1
|
0.107
|
0.025
|
3
|
0.025
|
1
|
0.110
|
0.028
|
4
|
0.050
|
1
|
0.093
|
0.021
|
5
|
0.100
|
1
|
0.100
|
0.029
|
6
|
0.300
|
1
|
0.088
|
0.018
|
7
|
0.500
|
1
|
0.091
|
0.020
|
8
|
0.700
|
1
|
0.074
|
0.012
|
9
|
1.000
|
1
|
0.184
|
0.043
|
Tubes
|
Starch concentration (M)
|
Amylase (ml)
|
Absorbance
(590
nm) / 35˚C
|
Absorbance
(mg/ml)
/ Sf
|
1
|
0.000
|
1
|
0.064
|
0.015
|
2
|
0.010
|
1
|
0.061
|
0.013
|
3
|
0.025
|
1
|
0.055
|
0.010
|
4
|
0.050
|
1
|
0.058
|
0.011
|
5
|
0.100
|
1
|
0.063
|
0.014
|
6
|
0.300
|
1
|
0.061
|
0.013
|
7
|
0.500
|
1
|
0.062
|
0.014
|
8
|
0.700
|
1
|
0.064
|
0.015
|
9
|
1.000
|
1
|
0.065
|
0.016
|
Tubes
|
Starch
concentration
|
Amylase
(ml)
|
Absorbance
(590
nm) / 10˚C
|
Absorbance
(mg/ml)
/ Sf
|
1
|
0.000
|
1
|
0.013
|
0.000
|
2
|
0.010
|
1
|
0.057
|
0.004
|
3
|
0.025
|
1
|
0.101
|
0.022
|
4
|
0.050
|
1
|
0.274
|
0.070
|
5
|
0.100
|
1
|
0.548
|
0.148
|
6
|
0.300
|
1
|
1.542
|
0.432
|
7
|
0.500
|
1
|
2.241
|
0.639
|
8
|
0.700
|
1
|
3.153
|
0.885
|
9
|
1.000
|
1
|
4.441
|
-
|
Temperature
1/S◦ (M)
|
10 ˚C
|
35 ˚C
|
40 ˚C
|
20.00
|
1379
|
1025
|
920
|
10.00
|
963
|
465
|
660
|
3.33
|
141
|
120
|
98
|
2.00
|
83
|
83
|
83
|
1.43
|
58
|
58
|
58
|
1.00
|
41
|
40
|
40
|
(data used to plot LB plot graph)
ii) Graph for the effect of temperature

D. the effect of pH

Discussion
A standard curve is a
type of graph used as a quantitative research technique. Multiple samples with
known properties are measured and graphed, which then allows the same
properties to be determined for unknown samples by interpolation on the graph.
The samples with known properties are the standards, and the graph is the standard
curve. Standard curves are
most commonly used to determine the concentration of a substance in this experiment, we want to know the concentration of starch present in each test tubes. The spectrophotometer reading will give us readings in unit nm, thus, standard curve will be plotted (absorbance nm vs absorbance in unit mg/ml). The reading of results from spectrophotometer in this experiment, will be converted to unit mg/ml by referring to this standard curve.
From the experiment conducted and the data obtained, the rate of digestion of the reaction for each sample can be calculated by referring to the formula given. The formula is:
V = ∆ S/ ∆ t = (S0 - SF) / 40 minutes
The result for the effect of substrate
concentration was tabulated in a table form. Then, from the table-containing
data, a graph of a Michaelis-Menten (MM plot) was plotted. The graph shown that
the Vmax value is 0.025 V and the Km value is 0.520 M. The
value of Km can be marked on the graph by dividing the Vmax value
with 2 (Vmax/2), and the x-horizontal shown the reading of Km.
Noted
that the concentration of starch increases (differ concentration in each tube) and
the volume of amylase added is constant (1 ml for each tube). In tube 1 only
amylase is present since no starch was added. In tube 2 which contain least
concentration of starch, when amylase is added, most of the starch has been
broken down into maltose. This occurred as the substrate (starch) combine with
the active site of enzyme (amylase) before being broken down into maltose. As a
result, once tested with iodine, none or less amount of starch concentration is
detected. In contrast, in the test tube 9 that has the highest concentration of
starch, not all starch was succeed to be broken down into maltose since the
amount of amylase provided is not enough. In the other word, the active site of
the enzyme became very saturated and no more substrate can be broken down. Hence
after tested with iodine, large amount of starch left in the tube was detected.
For an experiment on the effect of
temperature towards enzyme (amylase), different temperature of 40 ˚C, 35 ˚C and 10
˚C were prepared to observe the reaction rate of the amylase. The rate of
reaction can be seen from the Lineweaver-Burke graph plotted, where different
temperature performed different Km but have same Vmax cut
at the y-axis. The value of Vmax for all temperature should be the same since the amount of active site of enzyme is the same. By analyzing the graph, temperature that closer to the most effective
temperature for the amylase to break down the starch will have smallest Km,
and in this experiment the most desired temperature for the reaction to be
occurred is 40 ˚C followed 35 ˚C and 10 ˚C. this means that reaction at 40 ˚C has the higher affinity for the reaction to occur while reaction at 10 ˚C has the lowest affinity for the reaction to occur. Thus, the values of Km at
40 ˚C, 35 ˚C and 10 ˚C are 0.22 M, 0.29 M and 1.43 M. The value of Vmax is
0.032 V and same to all temperature provided. The value of 1/Vmax and 1/Km can be marked on the LB plot, there the actual value of Vmax and Km can be calculated.
α-amylases
are found in saliva, pancreatic juice, human breast milk, serum and certain
tissues such as the liver, beta amylase in plant product and gamma amylase also is found in human liver, but it is exist in weak acidic condition. This enzyme catalyzes the hydrolysis of α (1-4)
linkages in starch by breaking it down to maltose and some glucose. As the
starch is broken down, the coiled structure of α-amylase is unfolded.
Therefore, iodine will no longer be able to form the blue complex with the
α-amylase. Starch will be converted to maltose when amylase is added. The addition of iodine to starch will turn the solution into blue black when amylase are added, the colour turns to colorless indicate the presence of maltose and no presence of starch. It can be assumed that the decrease in color (absorbance) is
proportional to the product formed. In this experiment, the absorbance of the
starch-iodine complex wil be measured at 590 nm in 1 cm cuvettes using single
beam spectrophotometers. The intensity of the emerging beam will be decreased
because the solution absorbs some of the radiation. In this experiment, results shows that the low absorbance in neutral condition (pH 7), and thus, we predict that this is the alpha amylase. The fact is, there
is an optimum pH for every enzyme. pH is capable of altering the structure of
the active center in the enzyme causing denaturation. The optimum pH is not a
solid value. Usually they work quite well within a ph range (note that there
are those that will work properly in any pH value) Out of this range they will
act slowly tending to no inactivity (cause of denaturation).
Enzymes are biological or organic catalysts which speeds up a reaction without undergoing any permanent change themselves. The enzyme that we used was amylase. Amylase is an enzyme that catalyses the breakdown of starch into sugars that can be found in saliva. As the conclusion for this experiments, our objective was failed because our results does not follow the theory.
References:
Campbell, Reece, Urry, Cain, Wasserman, Minosky, Jackson (2008). Biology
8th edition. Pearson International Edition, 1301 Sansome St., San Francisco.
Bah Hock Guan, Tor Siong Hoon, Sri Nasariya (2009). Complete
reference matriculation biology 1 (2nd edition). Oriental
Academic Publication, Kuala Lumpur.
(2010, 02). The Effect of Temperature and Ph on Α-Amylase Enzyme
Activity. StudyMode.com.Retrieved May 1, 2012, from
http://www.studymode.com/essays/The-Effect-Of-Temperature-And-Ph-286442.html
0 comments:
Post a Comment